Critical Visualization
About
critical visualization network image

This network was funded from June 2016 - June 2018.

Visualization is proving to be a key part of research, dissemination, and teaching in the Humanities, supporting innovative endeavours ranging from virtual reconstructions of ancient cityscapes, through analysis of historical, cultural, and social networks, to the use of pattern recognition techniques for searches of image databanks. The process of creating visualizations involves data collection as much as remediation, processing, and interpretation of the data; yet a visualization is often perceived as a way to present and create knowledge that "simply" makes it more accessible.

This network proposed to critically explore the foundations, practices, and impacts of visualization, as much from a technological perspective as from a cognitive point of view, reflecting upon questions such as: what are the pros and cons of photo-realistic renditions? What cognitive assumptions do visualizations rely upon? How might one go about encouraging critical viewing as a means of thinking critically about data re-mediation and re-presentation, about visual (and non-textual) data? Is such “critical viewing” desirable, and in what contexts?

Exploring these questions, we sought to foster interdisciplinary resonances and commonalities alongside cordial and generative disagreement that would repay further debate.

This network intended to support this multidisciplinary exploration, creating a space for sharing and critical discussion of understandings and practices across a range of cross-divisional disciplines.

Our ambition was to work towards developing Critical Visualization as a field, with a shared vocabulary for exploring "the visual", particularly in a digital context. We hoped to further enable new practices and lenses on teaching, learning, research, and public engagement.


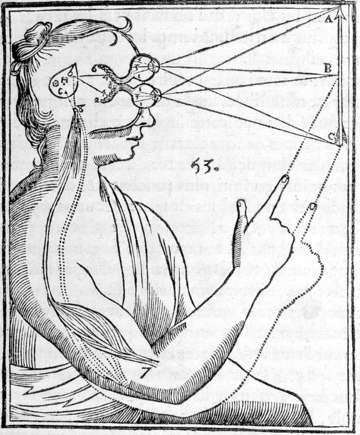
Photo source and credit: Illustration from: René Descartes, "L'homme ... et un traitté de la formation du fœtus. Du mesme autheur / Avec les remarques de Louys de la Forge ... sur le traitté de l'homme.” Paris : Charles Angot, 1664, p81.

This file comes from Wellcome Images, a website operated by Wellcome Trust, a global charitable foundation based in the United Kingdom. (This file is licensed under the Creative Commons Attribution 4.0 International license)

Contact:

Segolene Tarte

Pip Willcox

Erin Young

People

Convenors:

Segolene Taerte

Pip Wilcox

Erin Young

Alex Butterworth

Events
Past Events

Critical Vizualisation

critical visualization network image
 
Critical Visualization Network Launch (December 2016) 
Critically exploring the foundations, practices, and impacts of visualization 
Keynote lecture by Dr Igea Troiani (biography below) 
Discussion: planning the future of the network 
 
Critical Visualization Lunchtime Seminar (February 2017) 
The Network held a series of three Lunchtime Seminars between February and May 2017, each one featuring two 10-minute talks, covering an aspect of visualisation. 
Seminar 1 (February 2017) 
Wenbo Guo, DPhil student, Transport Studies Unit, School of Geography and the Environment at Oxford: Geographical Practices And Thinkings On Critical Visualisation 
Ségolène Tarte, Senior researcher at the e-Research Centre, Oxford: Topic: Drawings And Proofs: 
Seminar 2 (March 2017) 
Christine Madsen (Oxford e-Research Centre): Visualizing what isn’t there 
Martin John Hadley (IT services): The Interactive Data Network 
Seminar 3 (May 2017) 
Two 10 minute talks 
 
Critical Visualization One-Day Symposium with presentations, demonstrations, and panel sessions across the disciplinary spectrum (May 2017) 
Presentations, demonstrations, and panel sessions across the disciplinary spectrum. 
Critical Visualization Conclusions Workshop (June 2017)  
Programme: 
Review of the year’s activities 
Questions, comments, reactions 
Discussion: planning the future of the network 
 
Unflattening (June 2017) 
Speaker: Nick Sousanis  
Nick Sousanis, author of ‘Unflattening’ (2015), talks about his use of the comics form to develop new ways of critical thinking. 
 
Making Sense of Negotiated Text at Scale: A Workshop (November 2017) 
How do we evaluate the relationship between different iterations of ideas in text form? 
Speakers: 
Alfie Abdul-Rahman, Research Associate at the University of Oxford e-Research Centre who was developing web-based visualization tools for humanities scholars, including for the Quill Project. 
Nicholas Cole, Senior Research Fellow at Pembroke College Oxford, specializing in the history of political thought and American Constitutional History, and directs the Quill Project. 
Abhishek Dasgupta, doctoral student at Exeter College, studying Foundations, Logic, and Structures in the Department of Computer Science. 
David Doyle, Associate Professor of Latin American Politics in the Department of Politics and International Relations at the University of Oxford, a Fellow of St Hugh’s College, and co-investigator of the Fell-funded Measuring Government Policy with Text Analysis project. 
Félix Krawatzek, British Academy Postdoctoral Fellow based at the University of Oxford’s Department of Politics and International Relations and a Research Fellow at Nuffield College. 
David Price co-founded DebateGraph with the former Australian cabinet minister Peter Baldwin and has led DebateGraph’s projects with, amongst others, the UK Prime Minister’s Office, the White House Office of Science and Technology Policy, CNN, the European Commission, and the Bill & Melinda Gates Foundation. 
Radoslaw Zubek, Associate Professor of European Politics, a Tutorial Fellow at Hertford College, and principal investigator of the Fell-funded Measuring Government Policy with Text Analysis project. 
News
Blog